By now, you should be a little bit familiar with Pandas DataFrames and how to create a column of constant or empty signals.
To create a simple column of constant buy signals, you can use:
data['signal'] =1
Assigning Signals Based on Patterns
Trading strategies frequently require assigning signals dynamically based on patterns. Below are some common approaches:
1. Vectorized Assignment
Pandas allows us to compare columns without looping, which is called vectorization. This method is more efficient and often more readable for creating trading strategies.
Example: A signal of 1 when the close price is above 100, and 0 otherwise.
data['signal'] =0# Initialize with default value
data.loc[data['close'] >100, 'signal'] =1
Or for an even cleaner syntax:
data['signal'] =0# Initialize with default value
data['signal'] = (data['close'] >100).astype(int)
This efficiently assigns values across the entire column in one step. It may take a little getting used to, but it’s quite wonderful.
2. Looping
While vectorization is preferred for efficiency, you can loop through the DataFrame if necessary. Sometimes looping is easiest if you’d like to assign signals based on conditional statements.
Example: A signal that assigns 1 if the previous day’s close was greater than today’s close:
data['signal'] =0
for i inrange(1,len(data)):
if data['close'][i-1]> data['close'][i]:
data['signal'][i]=1
3. Lambda Functions
Lambda functions allow you to create small, anonymous functions that can be applied to DataFrame columns. This is useful for more customized signal logic without defining a separate function.
Example: A lambda function that assigns 1 if the close price is greater than the moving average of the last 5 days:
data['signal'] = data['close'].apply(
lambdax: 1if x > data['close'].rolling(window=5).mean().iloc[-1]
else0
)
This method is flexible for more complex logic but should be used with caution for performance reasons.
See the examples for specific use cases involving these methods!
Handling Missing Signals
If you leave the signal column mostly empty, Pandas will automatically fill empty entries with the most recent valid value using a forward fill. This means any gaps in the signal column are filled with the most recent trading signal.
signal
1
NaN
NaN
NaN
NaN
becomes
signal
1
1
1
1
1
With this in mind, it’s often useful to initialize the trading signal column with NaN. This effectively means, “generate signals only when conditions are met, and take no action in between.”
NaNs as signals can be thought of as “no action”.
In many strategies, such as the simple RSI Strategy, we start with NaN values to indicate that the generated position should be held until the next threshold is reached.
Other Columns in the DataFrame
We recommend adding all key metrics as columns to your DataFrame. Our software automatically detects these additional columns, allowing you to view them alongside your strategy results for deeper insights. You can track up to 6 additional columns.
Tracking additional indicators this way can be incredibly useful. Many of our examples include built-in support for these metrics, which are displayed below the main result plot.
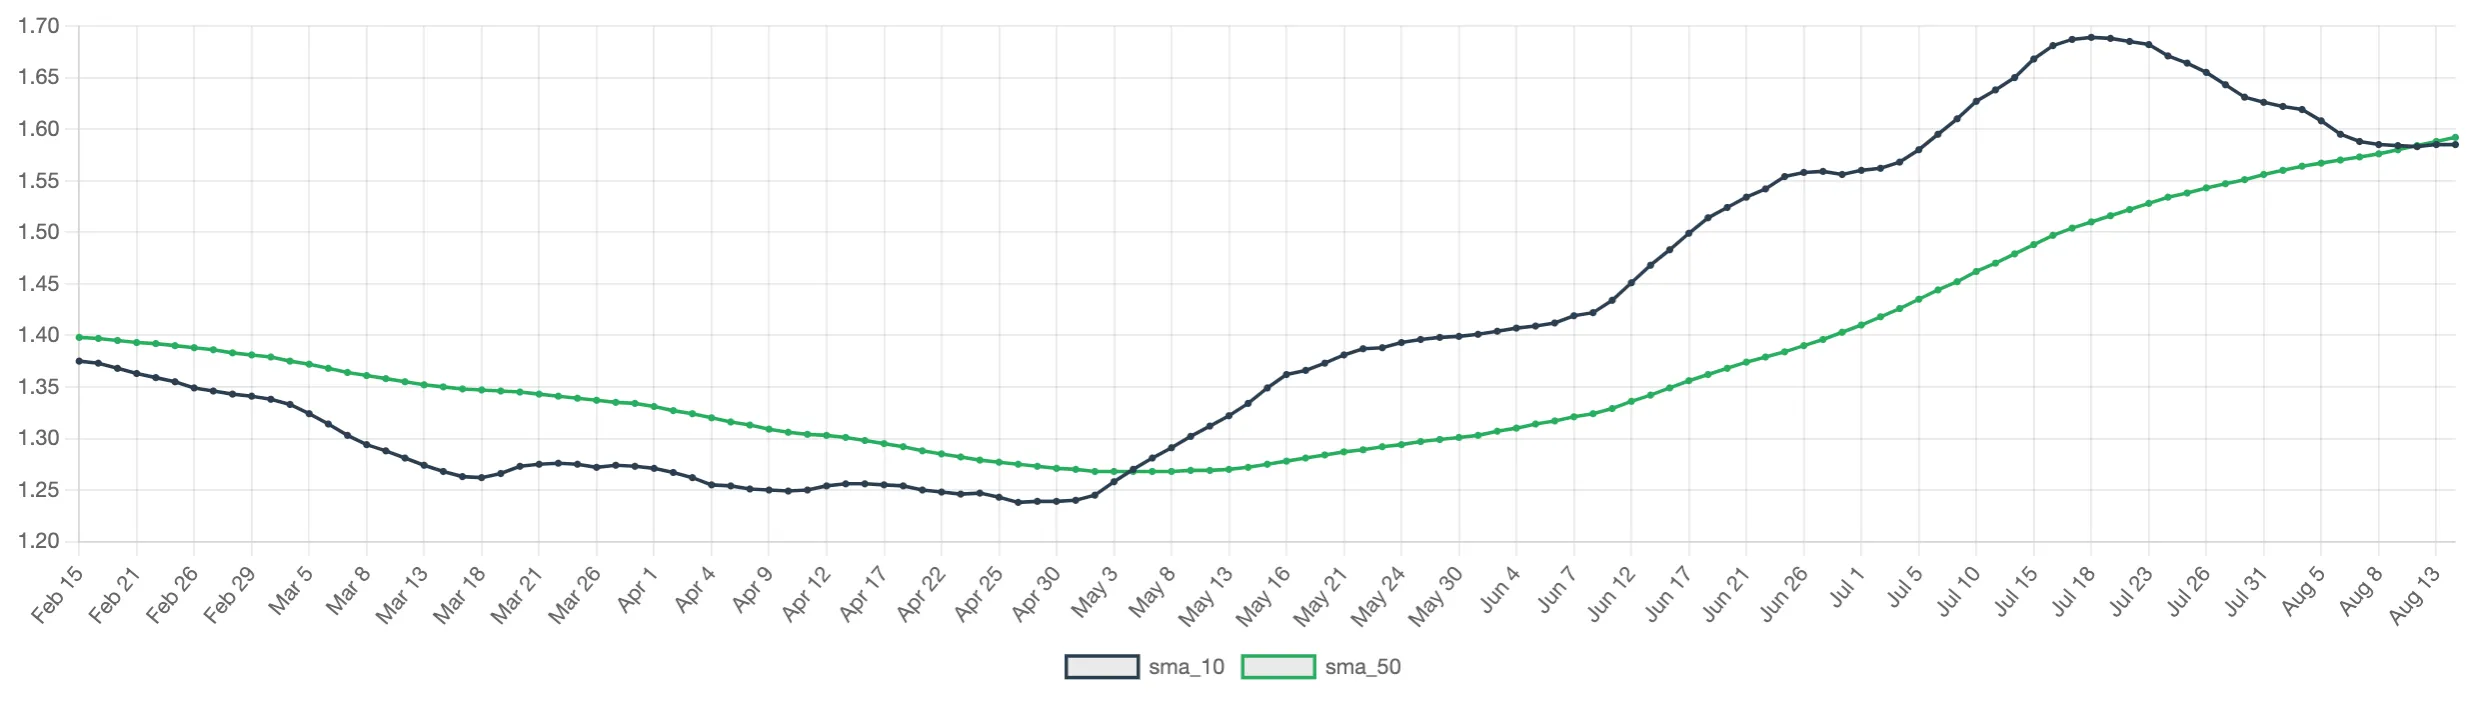
Example: If you include moving averages as columns in your DataFrame—such as data['sma_10'] and data['sma_50']—an additional chart will be displayed below the main chart:
More Resources
For more documentation on windowing operations that you can perform on DataFrames, which are immensely helpful for our financial calculations: Click Here