Your Second Strategy
We figure it is good to provide an example with a little more intensity than the introductory strategy. So, here you go:
Introduction
This second guide walks you through a basic yet powerful trading strategy: the Simple Moving Average (SMA) Crossover. By following along, you’ll get familiar with the backtesting framework while building a strategy that traders actually use in real markets.
The Example Strategy
Our strategy will use two simple moving averages:
- Short-term SMA (e.g., 10-day) – Captures recent price trends.
- Long-term SMA (e.g., 50-day) – Represents the broader trend.
Trading Rules
- Buy (1): When the short-term SMA crosses above the long-term SMA (bullish crossover).
- Short (-1): When the short-term SMA crosses below the long-term SMA (bearish crossover).
This approach helps us ride upward trends and bet against the asset when momentum weakens or reverses.
Strategy Code
'''Simple Moving Average Crossover Strategy
Generates buy/short signals based on two SMAs.'''
import pandas as pd
def strategy(data):    data['SMA_short'] = data['close'].rolling(10).mean()    data['SMA_long'] = data['close'].rolling(50).mean()
    data['signal'] = 0  # Initiate empty signal col    data.loc[data['SMA_short'] > data['SMA_long'], 'signal'] = 1  # Buy    data.loc[data['SMA_short'] < data['SMA_long'], 'signal'] = -1  # Short
    return data
Understanding the Strategy Code
Like all trading strategies, this function follows a clear structure:
- Accepts a dataset of stock prices as input.
- Computes two moving averages (
SMA_shortandSMA_long). - Generates a
signalcolumn based on crossover conditions. - Returns the updated dataset for backtesting.
The core logic is simple:
data.loc[data['SMA_short'] > data['SMA_long'], 'signal'] = 1data.loc[data['SMA_short'] < data['SMA_long'], 'signal'] = -1This ensures that when the short SMA crosses above the long SMA, we go long (buy). When it crosses below, we go short.
Running the Strategy in the Editor
Now that the strategy is ready, let’s backtest it:
- Open the Strategy Editor and paste in the code.
- Select a stock (e.g., AAPL) and a time range.
- Run the strategy and analyze the results.
For this example, let’s test AAPL from Jan 1, 2022, to Jan 1, 2023.
Backtest Results
If you’ve followed the steps correctly, your backtest should generate a performance chart.
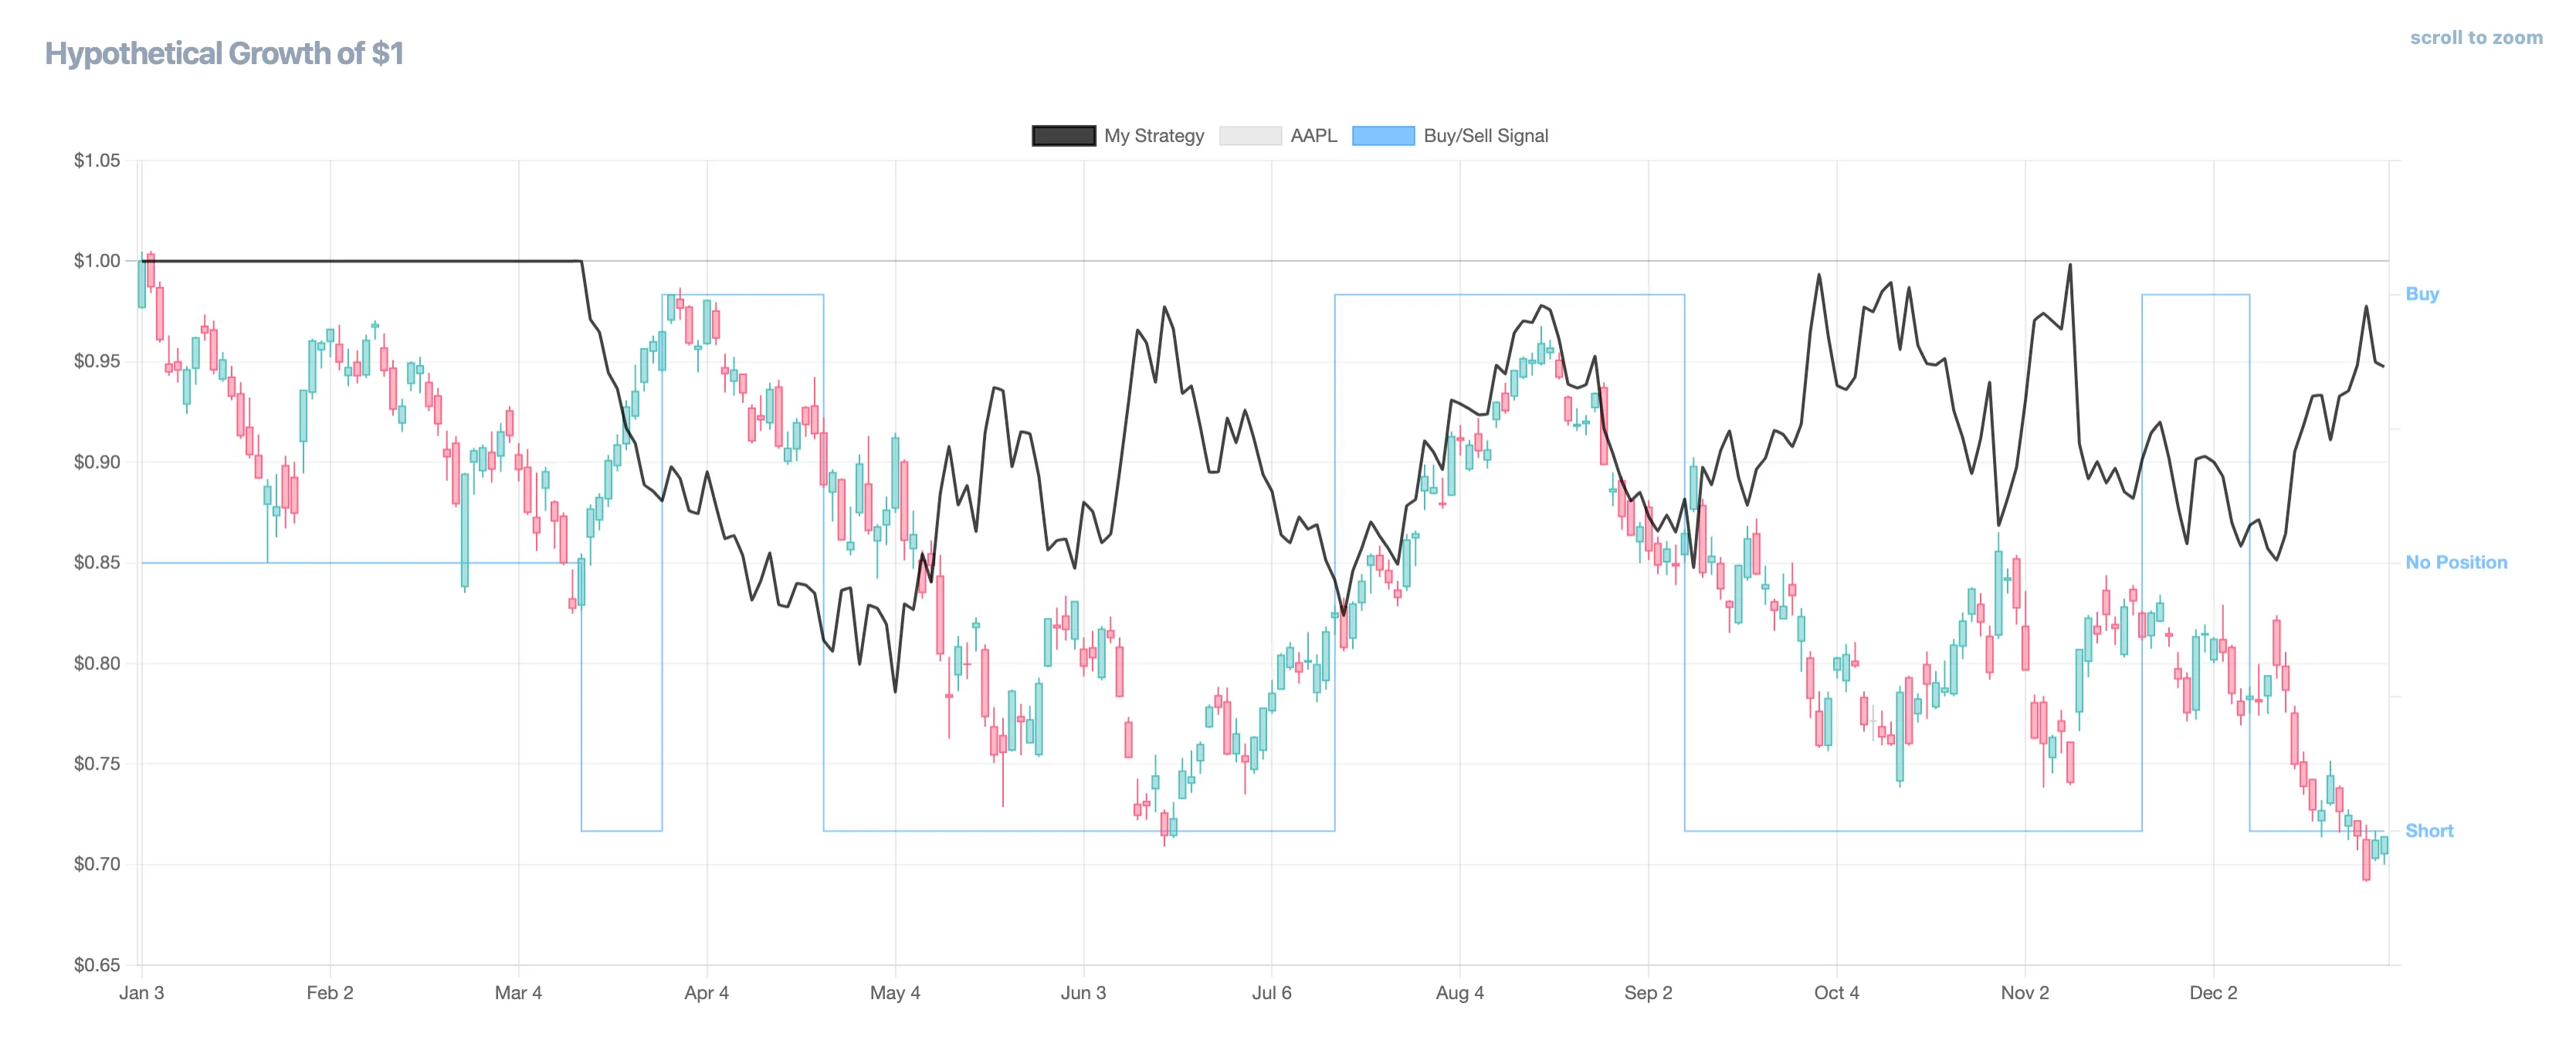
- The blue line represents the SMA crossover signals.
- The candlestick chart shows AAPL’s price movements.
- The black portfolio value line tracks performance based on signals.
Next Steps
- Experiment with different SMA lengths (e.g., 20-day vs. 100-day).
- Test on different stocks to compare performance.
- Explore more strategy examples!