Your First Strategy
Introduction
This guide walks you through a simple example to help you get oriented with the backtesting framework and its core principles. You’ll soon see that the possibilities are endless.
The Example Strategy
To start, we’ll implement a very basic strategy: assigning a random trading signal each day.
The strategy randomly chooses between:
- Buy (1) – Going long on the asset
- Short (-1) – Betting against the asset
Of course, this is not a strategy you’d want to use in real life, but it’s a great way to get familiar with the framework.
Strategy Code
'''Random Trading Strategy
Assigns a random signal (-1 or 1) to each trading day.'''
import numpy as np
def strategy(data):    data['signal'] = np.random.choice([-1, 1], size=len(data))    return data
Understanding the Strategy Code
Every trading strategy (ours included) is defined as a Python function named strategy. This function:
- Accepts a table of stock data as input. (
def strategy(data)) - Modifies the table by adding a
signalcolumn. (data['signal'] = ...) - Returns the updated table, which the backtesting engine will use. (
return data)
Where the Magic Happens
A valid trading strategy must include a signal column, which determines whether to buy or short an asset on each trading day.
In our case, we simply assign random -1 or 1 values to the column. We use the NumPy library, and make sure the number of signals is equal to the number of timepoints:
data['signal'] = np.random.choice([-1, 1], size=len(data))Once this is done, we return the modified dataset—with the signal column added—and the backtest engine takes care of the rest!
Running the Strategy in the Editor
Now that our strategy is ready, let’s run it against real stock data.
- Open the Strategy Editor. Copy and paste in the strategy from above.
- Select a stock and a date range.
- Run the strategy.
For this example, we’ll use AAPL stock from Jan 1, 2022, to Mar 1, 2022.
Backtest Results
If you’ve followed along, you’ll see a chart displaying your portfolio’s performance. It won’t look the same as ours; it is a random strategy. We gained ~15% of our initial capital.
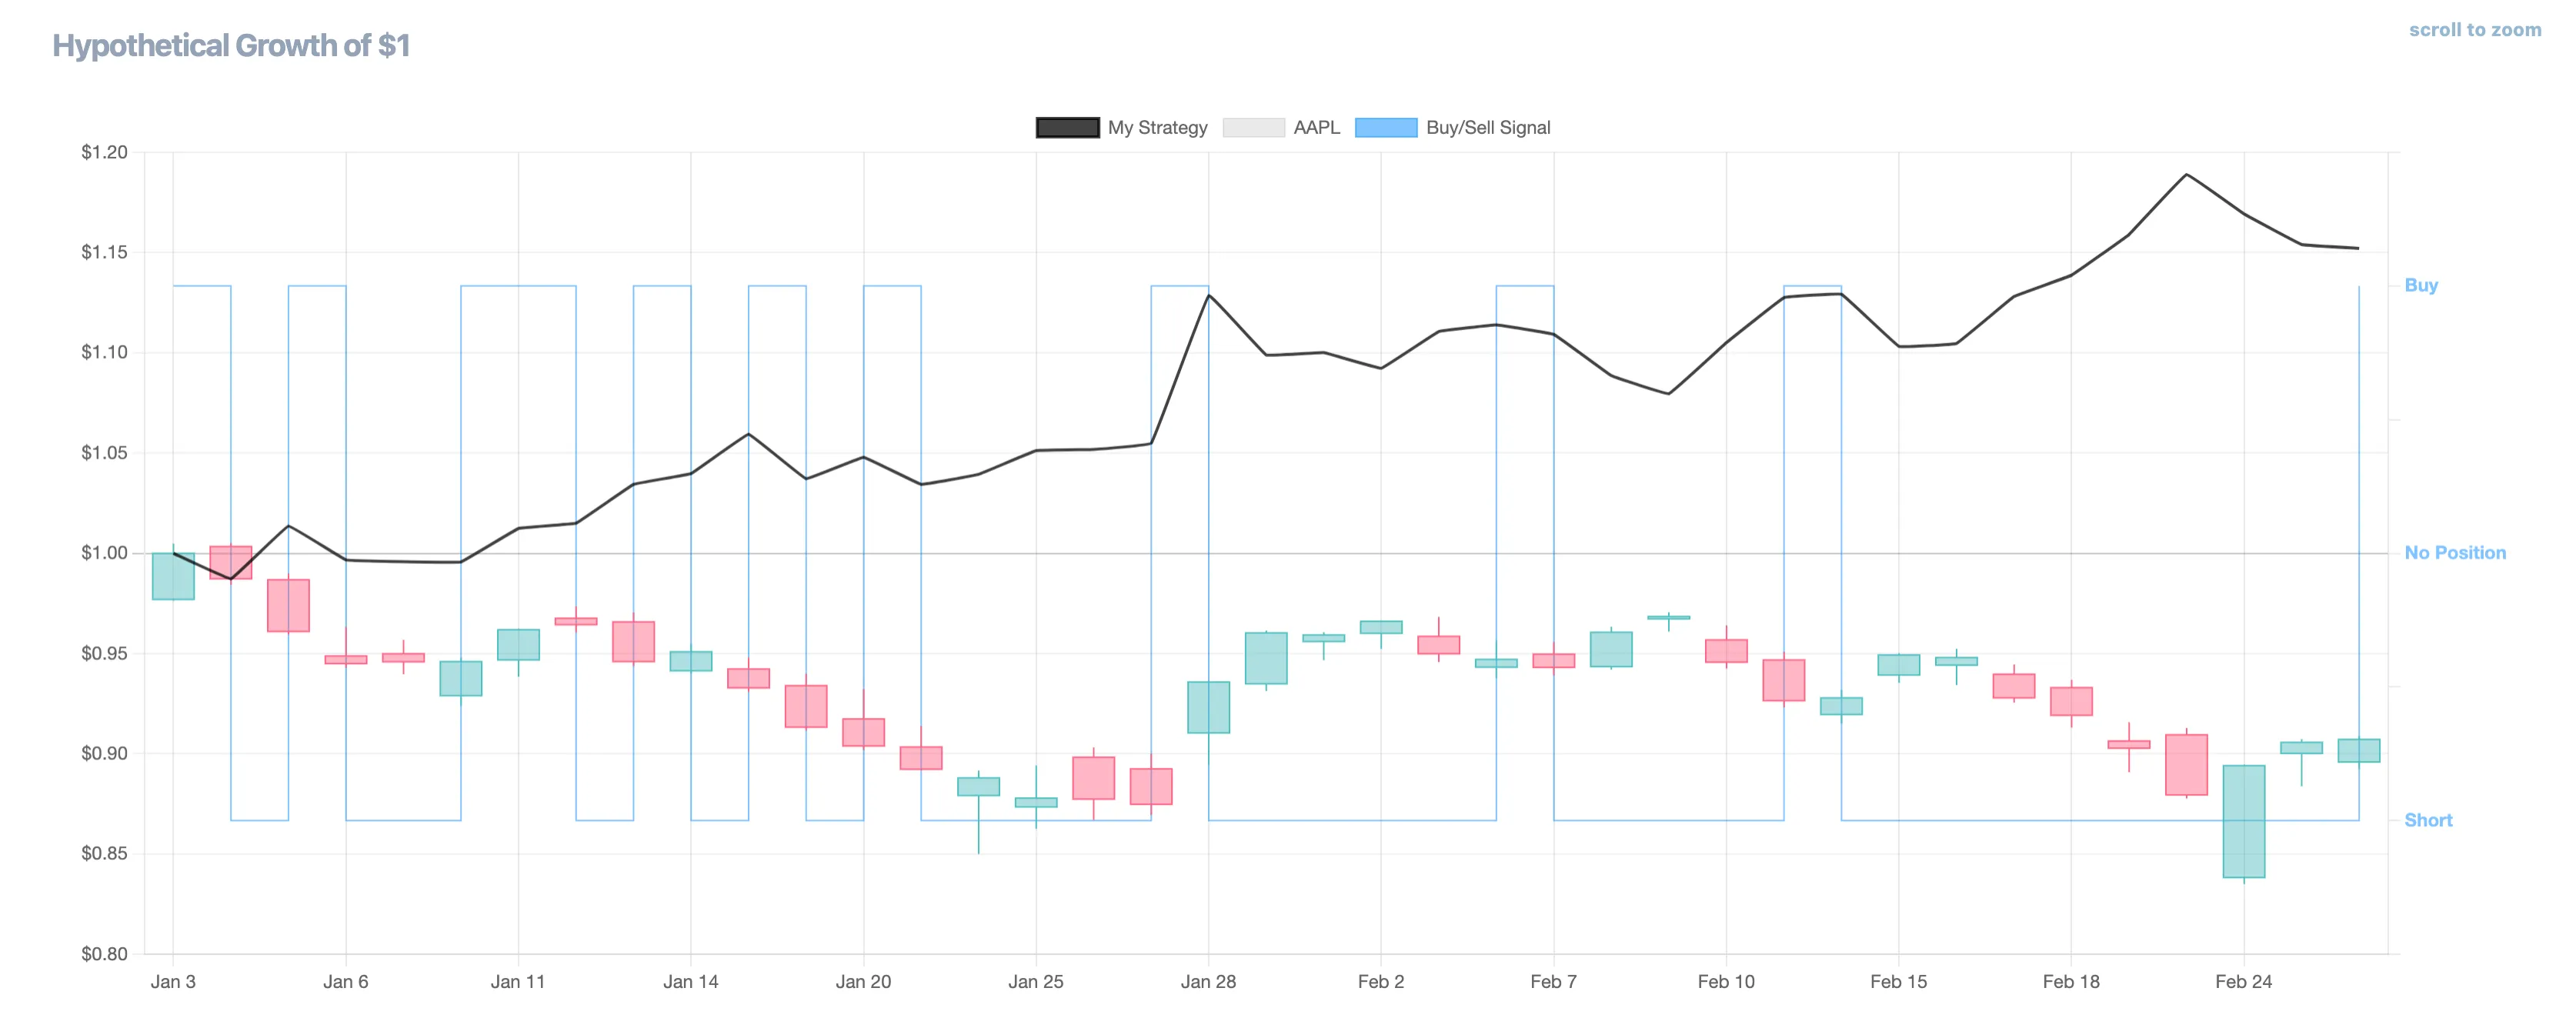
- The blue line represents the trading signals over time.
- The candlestick data is that of
AAPL’s open/high/low/close price over the same period. - Our portfolio (black line) starts at $1 and fluctuates based on the random signals.
Funny enough, we actually outperformed
AAPL, but let’s be clear—it’s generally not a great idea to trade randomly!
Next Steps
- Save your result to compare later.
- Try different stocks & time periods to see variations in performance.
- Modify the strategy to introduce more structure—maybe adding trend-following or mean-reversion rules!
- Try one of our many examples!